How to Read Your Solar Monitoring App Data (2026)
Learn how to read solar monitoring app data, spot underperformance early, and know when to call for a repair check on your CT, MA, or RI solar system.
Dan Katzman
Teamsun
Most homeowners open their solar monitoring app once after install, get excited about the numbers, then never check it again until the electric bill jumps. Learning how to read solar monitoring app data means knowing four numbers, understanding what's normal for the season, and catching a real fault before it costs you months of lost production.
Key Takeaways
- Four numbers matter most: current output (kW), daily/monthly energy (kWh), consumption vs. export, and system status alerts.
- Seasonal swings are normal: a Connecticut system can produce 3-4x more energy in June than in December due to daylight hours alone.
- 10-15% is the threshold: a sustained drop below that range for more than a few days, with no weather explanation, signals a real problem.
- Panel-level data catches issues early: Enphase, SolarEdge, and similar systems can flag a single underperforming panel before it drags down the whole array.
- Any-brand service exists: if your original installer is gone, a company can still diagnose and repair systems it didn't install.
At a Glance: Solar Monitoring Metrics
| Metric | Normal Range | Warning Sign |
|---|---|---|
| Current production (kW) | Matches array size on clear midday sun | Zero or near-zero during peak sun hours |
| Daily energy (kWh) | Varies by season and system size | Sudden 10-15%+ drop with no weather cause |
| Monthly energy (kWh) | Peaks June-August, lowest Nov-Jan | Flat or declining trend month over month in growing-daylight season |
| Panel/string-level output | Roughly even across all panels | One panel or string reading significantly lower or offline |
| System status/alerts | "Online" or "Normal" with no active faults | Fault codes, "offline," or "communication lost" messages |
| Consumption vs. export | Export rises on sunny low-usage days | Consumption logged but zero export despite excess production |
1. Find the Four Numbers That Actually Matter
Every monitoring app, whether it's Enphase, SolarEdge, Tesla, or FranklinWH, buries a lot of charts and settings around four core data points. Find these first and ignore the rest until you need them.
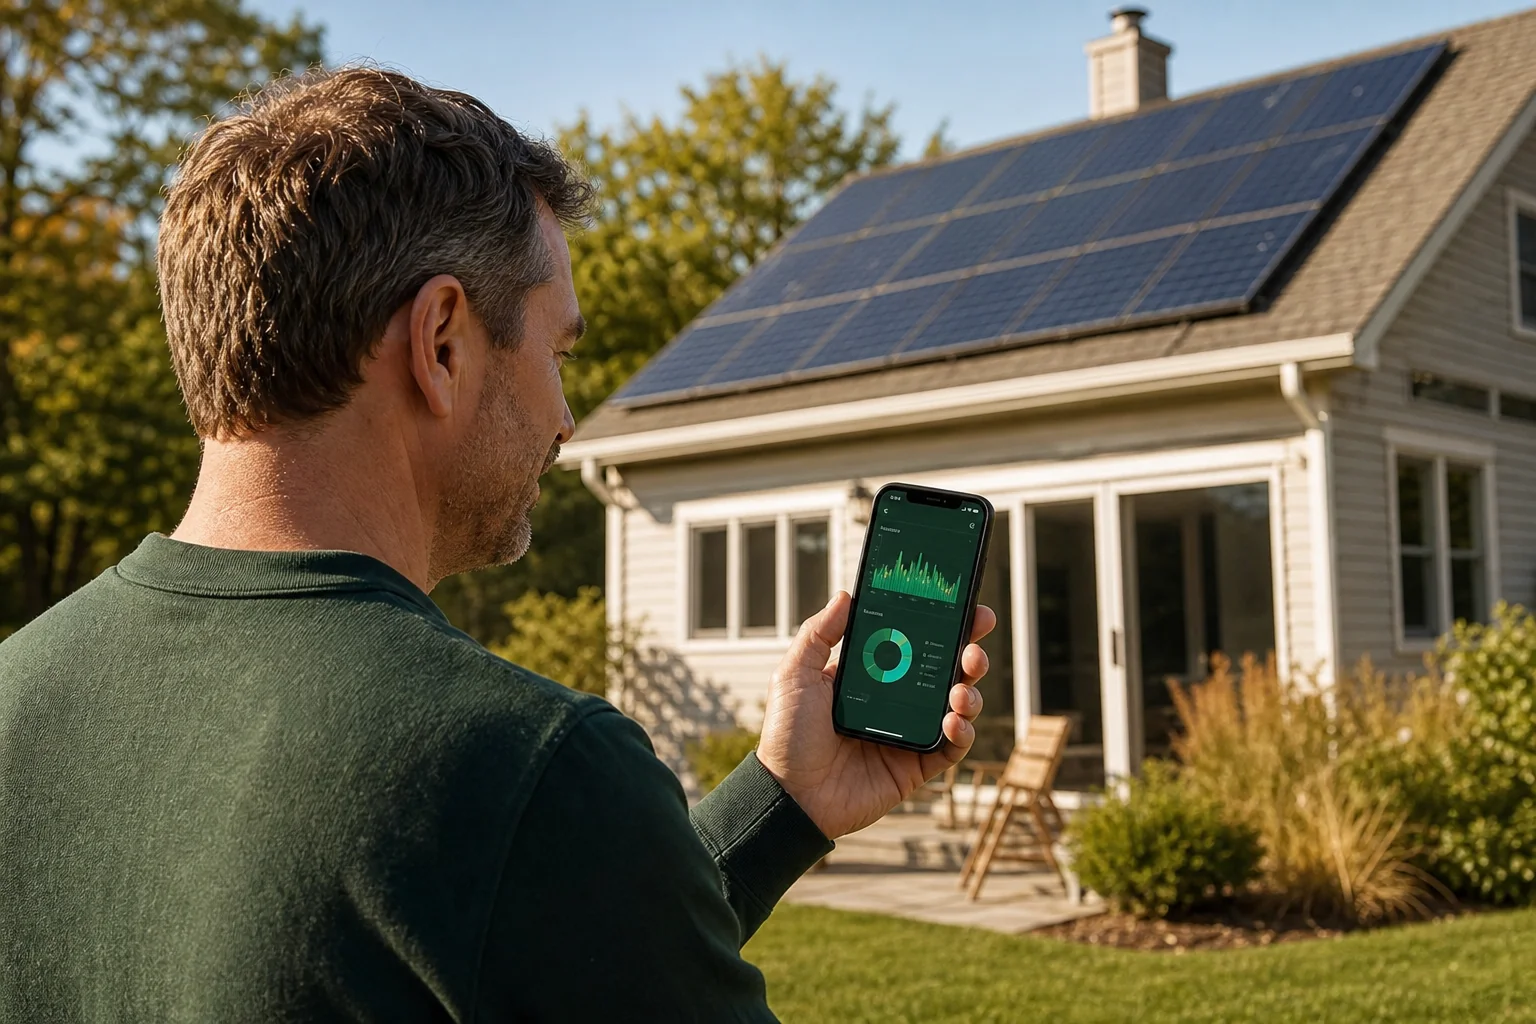
Current production shows what your system is generating right now, in kilowatts. On a clear day near solar noon, this should approach your system's rated size. An 8kW system reading 1.2kW at noon in July is a red flag, not a coincidence.
Daily and monthly energy totals, measured in kilowatt-hours, tell you how much your system has actually produced. This is the number that ties back to your electric bill and net metering credits.
Third, look at consumption versus export. Most apps show how much power your home used against how much your panels sent back to the grid. A well-sized system should show meaningful export on sunny days when the house isn't drawing heavily.
Last is the system status panel, usually a small icon or banner. It should say "normal" or "online." Anything else, including a fault code or a component listed as unreachable, deserves attention.
2. Know What Normal Output Looks Like by Season
A system that produces 35 kWh on a June day and 8 kWh on a December day isn't broken. It's following the sun. Connecticut, Massachusetts, and Rhode Island see roughly twice the daylight hours in June compared to December, and panel efficiency also drops slightly in extreme heat.
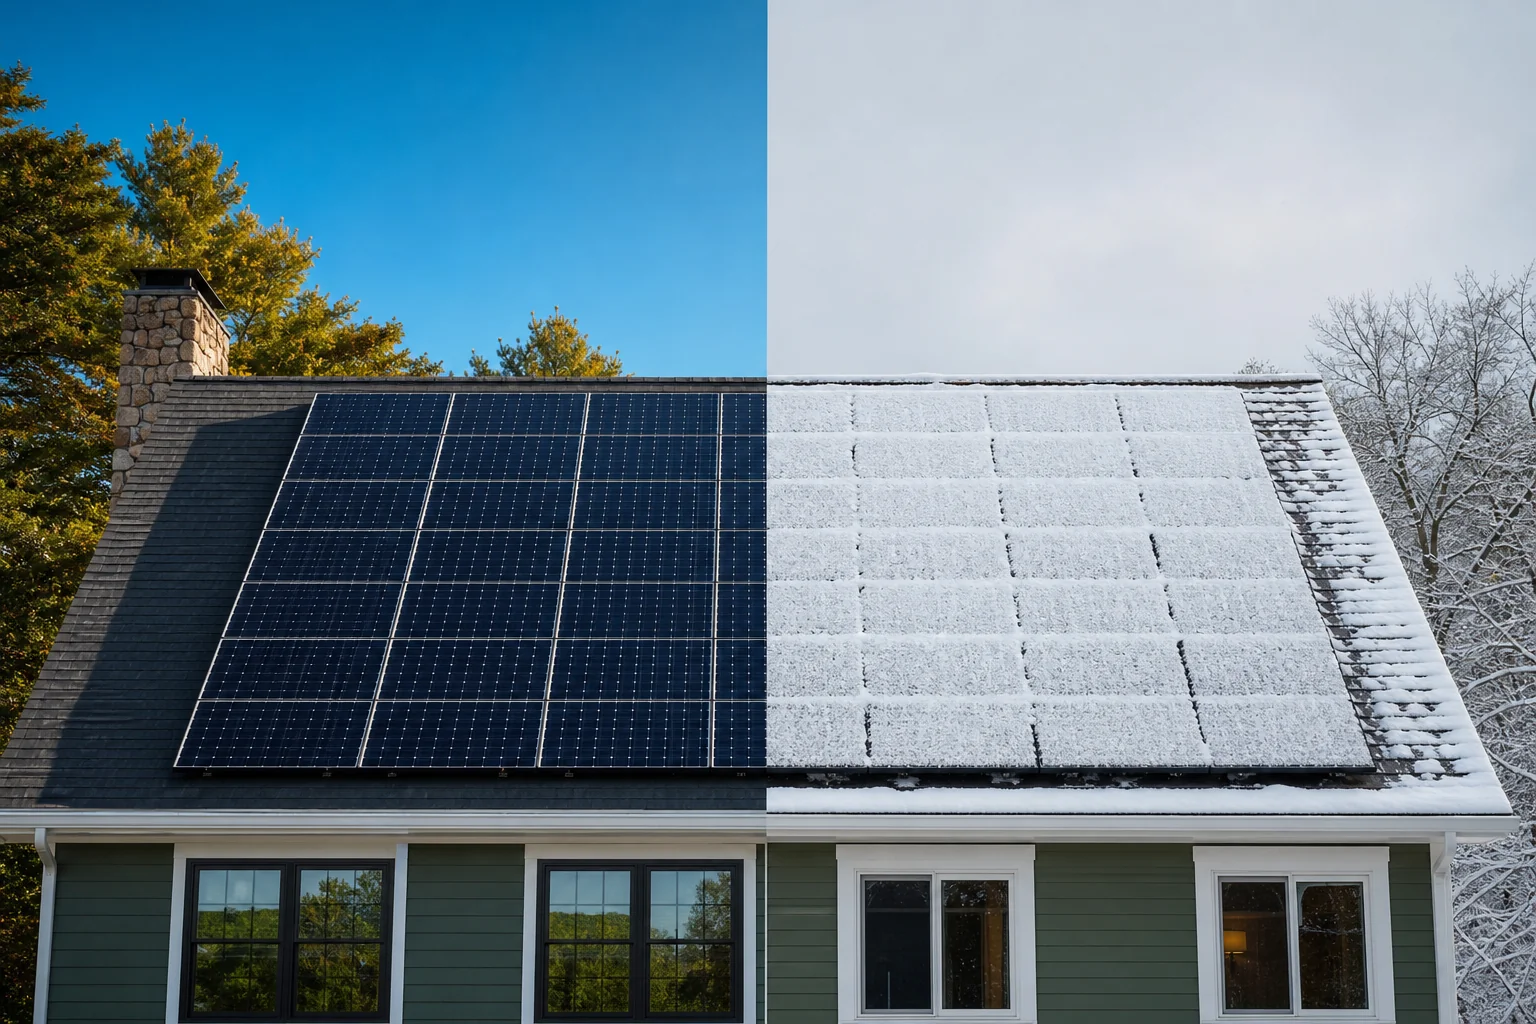
Summer months (May through August) are your production peak. Expect the highest daily kWh totals of the year, with occasional dips from afternoon thunderstorms or haze.
Winter (November through February) brings the lowest totals. Shorter days, lower sun angle, and occasional snow cover on the panels all cut into output. A light dusting of snow that melts by midday is normal and not worth a service call.
Spring and fall are shoulder seasons. Production climbs steadily from March into May, then tapers from September into November. Comparing a March reading to a July reading and assuming a problem is a common, avoidable mistake.
Is a Drop in Solar Production Always a Problem?
No. A drop tied to shorter days, cloud cover, or seasonal sun angle is expected and not a fault. A real problem shows up as a drop that doesn't track with weather or season, especially if it persists for several days or comes with an active fault alert.
3. Check Production Against Your System's Size
A rough benchmark for the Northeast: a well-placed system produces roughly 1,100 to 1,400 kWh per year for every kW of installed capacity, spread unevenly across the seasons described above. An 8kW system might land near 9,600 kWh annually in this region.
Use your app's historical view, usually a monthly or yearly chart, to compare this year's output to last year's for the same month. That comparison matters more than checking today against yesterday, since day-to-day weather noise can mask or mimic a real issue.
If you're weighing whether your current system is still sized right for your usage, especially after adding an EV or a heat pump, it's worth reviewing how solar sizing affects savings on higher electric bills.
4. Watch for These Warning Signs
Most monitoring apps are built to make small dips look dramatic and real faults easy to miss. Train your eye on these specific patterns instead.
- Sudden production cliff: a 10-15% or greater drop that holds for three or more days with clear skies and no snow.
- One panel or string flatlining: the rest of the array performs normally while a single section reads zero or far below its neighbors.
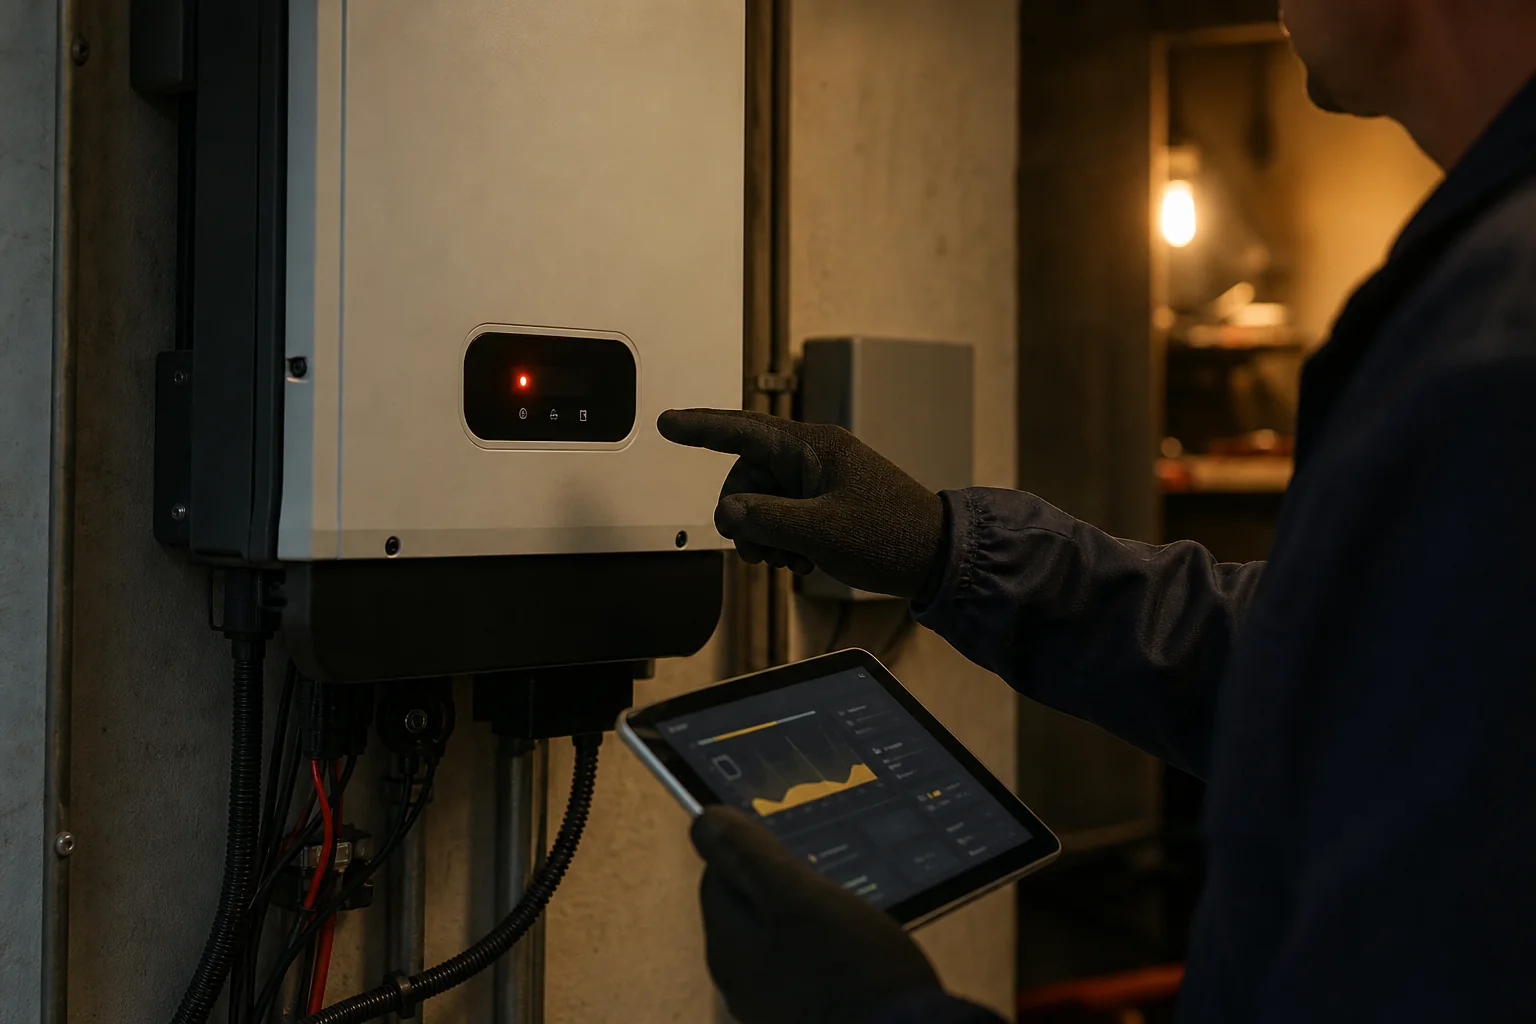
- Fault codes or offline inverter: most apps push a notification, but check the status panel directly if your bill looks off.
- Zero production during daylight: even overcast skies should show some output; true zero during daytime points to a tripped breaker or inverter shutdown.
- Consumption logged with no export: if the house is pulling low power on a sunny day but the app shows zero sent to the grid, something between the panels and the meter isn't working.
5. Compare Panel-Level Data, Not Just System Totals
Microinverter and optimizer-based systems, like Enphase and SolarEdge setups, report data down to the individual panel. That granularity is the fastest way to catch a problem before it drags down your whole system's numbers.
Open the panel-level or "layout" view in the app and scan for outliers. A single panel reading 20% below its neighbors on a clear day usually points to shading, a loose connection, or a failing microinverter, not a system-wide issue.
String inverter systems and battery platforms like Tesla or FranklinWH typically report at a coarser level, sometimes by string or by battery unit rather than by individual panel. If you're deciding between battery platforms and want to understand how each reports data, comparing Tesla Powerwall and FranklinWH monitoring is worth a look before you buy.
6. Know When to Call for a Repair Check
A single bad-weather day doesn't warrant a service call. A sustained drop of 10-15% or more over several days, a persistent fault code, or a panel that's stayed dark for over a week does.
When you call, a technician will typically pull your monitoring history, check inverter and combiner box connections, inspect for physical damage or debris, and test individual panel output against the app's readings. This usually resolves in a single visit for most common issues.
You don't need to go back to your original installer if that company is no longer around or simply unresponsive. Teamsun services and repairs solar systems of any brand, including ones it didn't install, which matters if your installer has closed shop or your warranty contact has gone quiet. You can read more about finding a repair company for a system of any brand before assuming a costly replacement is your only option.
What If My Solar Company Isn't Around Anymore?
An orphaned solar system, one whose original installer has closed or stopped responding, can still be diagnosed and repaired by a different local company. Teamsun services any brand of panels, inverters, or batteries regardless of who installed them originally.
FAQ
How often should I check my solar monitoring app?
Once a week is enough for most homeowners. Checking daily invites false alarms from normal weather swings; checking monthly risks missing a fault that costs you weeks of lost production.
Why does my app show different numbers than my utility bill?
Your app measures what the panels produce. Your utility bill reflects net metering credits after your household consumption is subtracted, which is a different number by design. For a deeper look at how those credits work, see how solar net metering works with your utility.
Can weather alone explain a big production drop?
Yes, for a day or two. Heavy cloud cover, storms, or fresh snow can cut output by 50% or more temporarily. If the drop persists past a few clear days, weather stops being a valid explanation.
Do batteries change what I should monitor?
Yes. With a battery, you'll also want to track state of charge and charge/discharge cycles, not just production. A battery that isn't charging fully on a sunny day can point to the same underlying issues as a production drop. Learn more about how a battery retrofit changes your monitoring setup if you're considering adding storage to an existing system.
Reading your solar monitoring app data well means the difference between catching a $200 problem in week one versus discovering it in month six after it's quietly cost you hundreds in lost production. If your numbers don't match what this guide describes as normal, don't guess. Request a free quote for a diagnostic, or talk to a designer about what your specific readings mean. You can also call 203-903-4091 directly, or explore Teamsun's full range of services, including repair and maintenance for systems installed by any company.
Recommended Resources
Written by
Dan Katzman
Teamsun
Teamsun writes practical solar guidance to help property owners compare equipment, project scope, costs, and long-term service before making a decision.
Keep going.
How Does Solar PPA Financing Work in 2026?
Learn how solar PPA financing works in 2026, from rate calculations to 620 FICO underwriting, and see how it stacks up against loans and cash purchases.
Dan Katzman
Teamsun
How to Combine Solar Panels With Battery Backup (2026)
Learn how solar panel installation with home battery backup works, from wiring to outage performance to sizing a battery for true energy independence.
Dan Katzman
Teamsun
How to Install a Hardwired EV Charger at Home (2026)
Learn how to install a hardwired EV charger at home in 2026: panel capacity checks, permits, licensed installers, and pairing with solar or battery.
Dan Katzman
Teamsun